Health Assessment - Vision
Vision
The vision domain in TILDA comprises a range of objective ophthalmic assessments designed to evaluate visual function and ocular health in older adults. Measures collected across waves include visual acuity, contrast sensitivity, and retinal photography, providing information on both functional vision and retinal structure. These assessments support research into age-related eye disease, macular degeneration, visual impairment, cognitive ageing, vascular health, falls, mobility, and broader health outcomes.
Vision Measures
Click each heading to expand details of this test.
Overview
Measuring: Contrast sensitivity measures the limit of visibility for low-contrast patterns, indicating how faded or washed-out images can be before they become indistinguishable from the background (e.g., driving in fog).
Equipment used: Functional Visual Analyser (FVA)
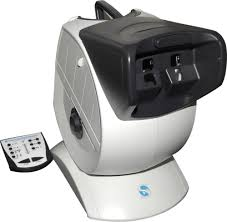
Equipment Description: The FVA presents a series of grey lines within numbered boxes under controlled illumination and glare conditions. The participant identifies the orientation of the lines, and the device records the responses. The FACT software calculates a contrast sensitivity score for each row, which is saved using the participant’s unique TILDA ID.
Assessment Type: Centre Assessment Only
Protocol
- The participant sits comfortably at the FVA, wearing their distance corrective lenses.
- The instrument and table are adjusted for proper height and tilt, and the forehead activator is used to stabilize head position.
- One eye is tested under low light, no glare conditions.
- The participant identifies the orientation of lines in boxes numbered 1–9, progressing through five rows of increasing difficulty (dial positions 5–9).
- Responses are recorded on the FACT score sheet, and the test is repeated for accuracy if needed
Collection Waves
| Measure | Wave 1 | Wave 2 | Wave 3 | Wave 4 | Wave 5 | Wave 6 |
|---|---|---|---|---|---|---|
| Contrast Sensitivity | X | X |
Example TILDA Papers
- Duggan, E, Donoghue, OA, Kenny, RA, Cronin, H, Loughman, J, Finucane C. (2017). Time to Refocus Assessment of Vision in Older Adults? Contrast Sensitivity but Not Visual Acuity Is Associated With Gait in Older Adults. The Journals of Gerontology: Series A, 72(12): 1663–1668. https://doi.org/10.1093/gerona/glx021
Overview
Measuring: Retinal photography is used to obtain high-resolution colour images of the ocular fundus for assessment of retinal structure and microvascular health. Retinal imaging provides objective documentation of retinal vessels, optic disc, and macular region, and may be used to assess indicators of systemic vascular disease and ocular pathology. Retinal photography was conducted as part of the Health Assessment at Wave 1 and Wave 3.
Equipment used: Zeiss VISUCAM 200 retinal camera
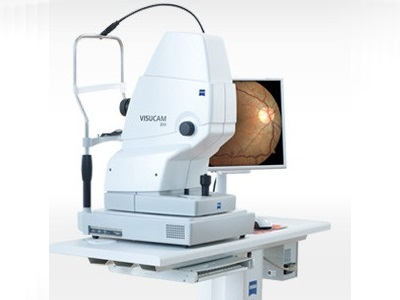
Equipment Description: The Zeiss VISUCAM 200 is a non-mydriatic digital fundus camera that captures 45° colour retinal images. It includes integrated patient management software, internal fixation, auto-focus capability, adjustable chin and forehead rests, and DICOM image export. Images are stored and exported using TILDA IDs.
Assessment Type: Centre Assessment Only
Protocol
- The camera is powered on and a new participant record is created using the 5-character TILDA ID.
- The participant is seated with chin and forehead correctly positioned and glasses removed.
- Room lights are turned off and, after approximately 30 seconds with eyes closed, 45° colour retinal images are captured of the right and left eyes using internal fixation and auto-focus.
- Image quality is checked immediately, with a maximum of two attempts per eye.
- Images are retained and exported in DICOM (
*.dcm) format to a secure network location labelled with the TILDA ID. - The procedure is stopped if the participant experiences discomfort.
Collection Waves
| Measure | Wave 1 | Wave 2 | Wave 3 | Wave 4 | Wave 5 | Wave 6 |
|---|---|---|---|---|---|---|
| Retinal Photography | X | X |
Example TILDA Papers
- Akuffo, K.O., Nolan, J., Stack, J., Moran, R., Feeney, J., Kenny, R.A., Peto, T., Dooley, C., O’Halloran, A.M., Cronin, H. and Beatty, S. (2015). Prevalence of age-related macular degeneration in the Republic of Ireland. British Journal of Ophthalmology, 99(8): 1037–1044. https://doi.org/10.1136/bjophthalmol-2014-305768
Overview
Measuring: Acuteness or clearness of vision.
Equipment used: LogMAR charts
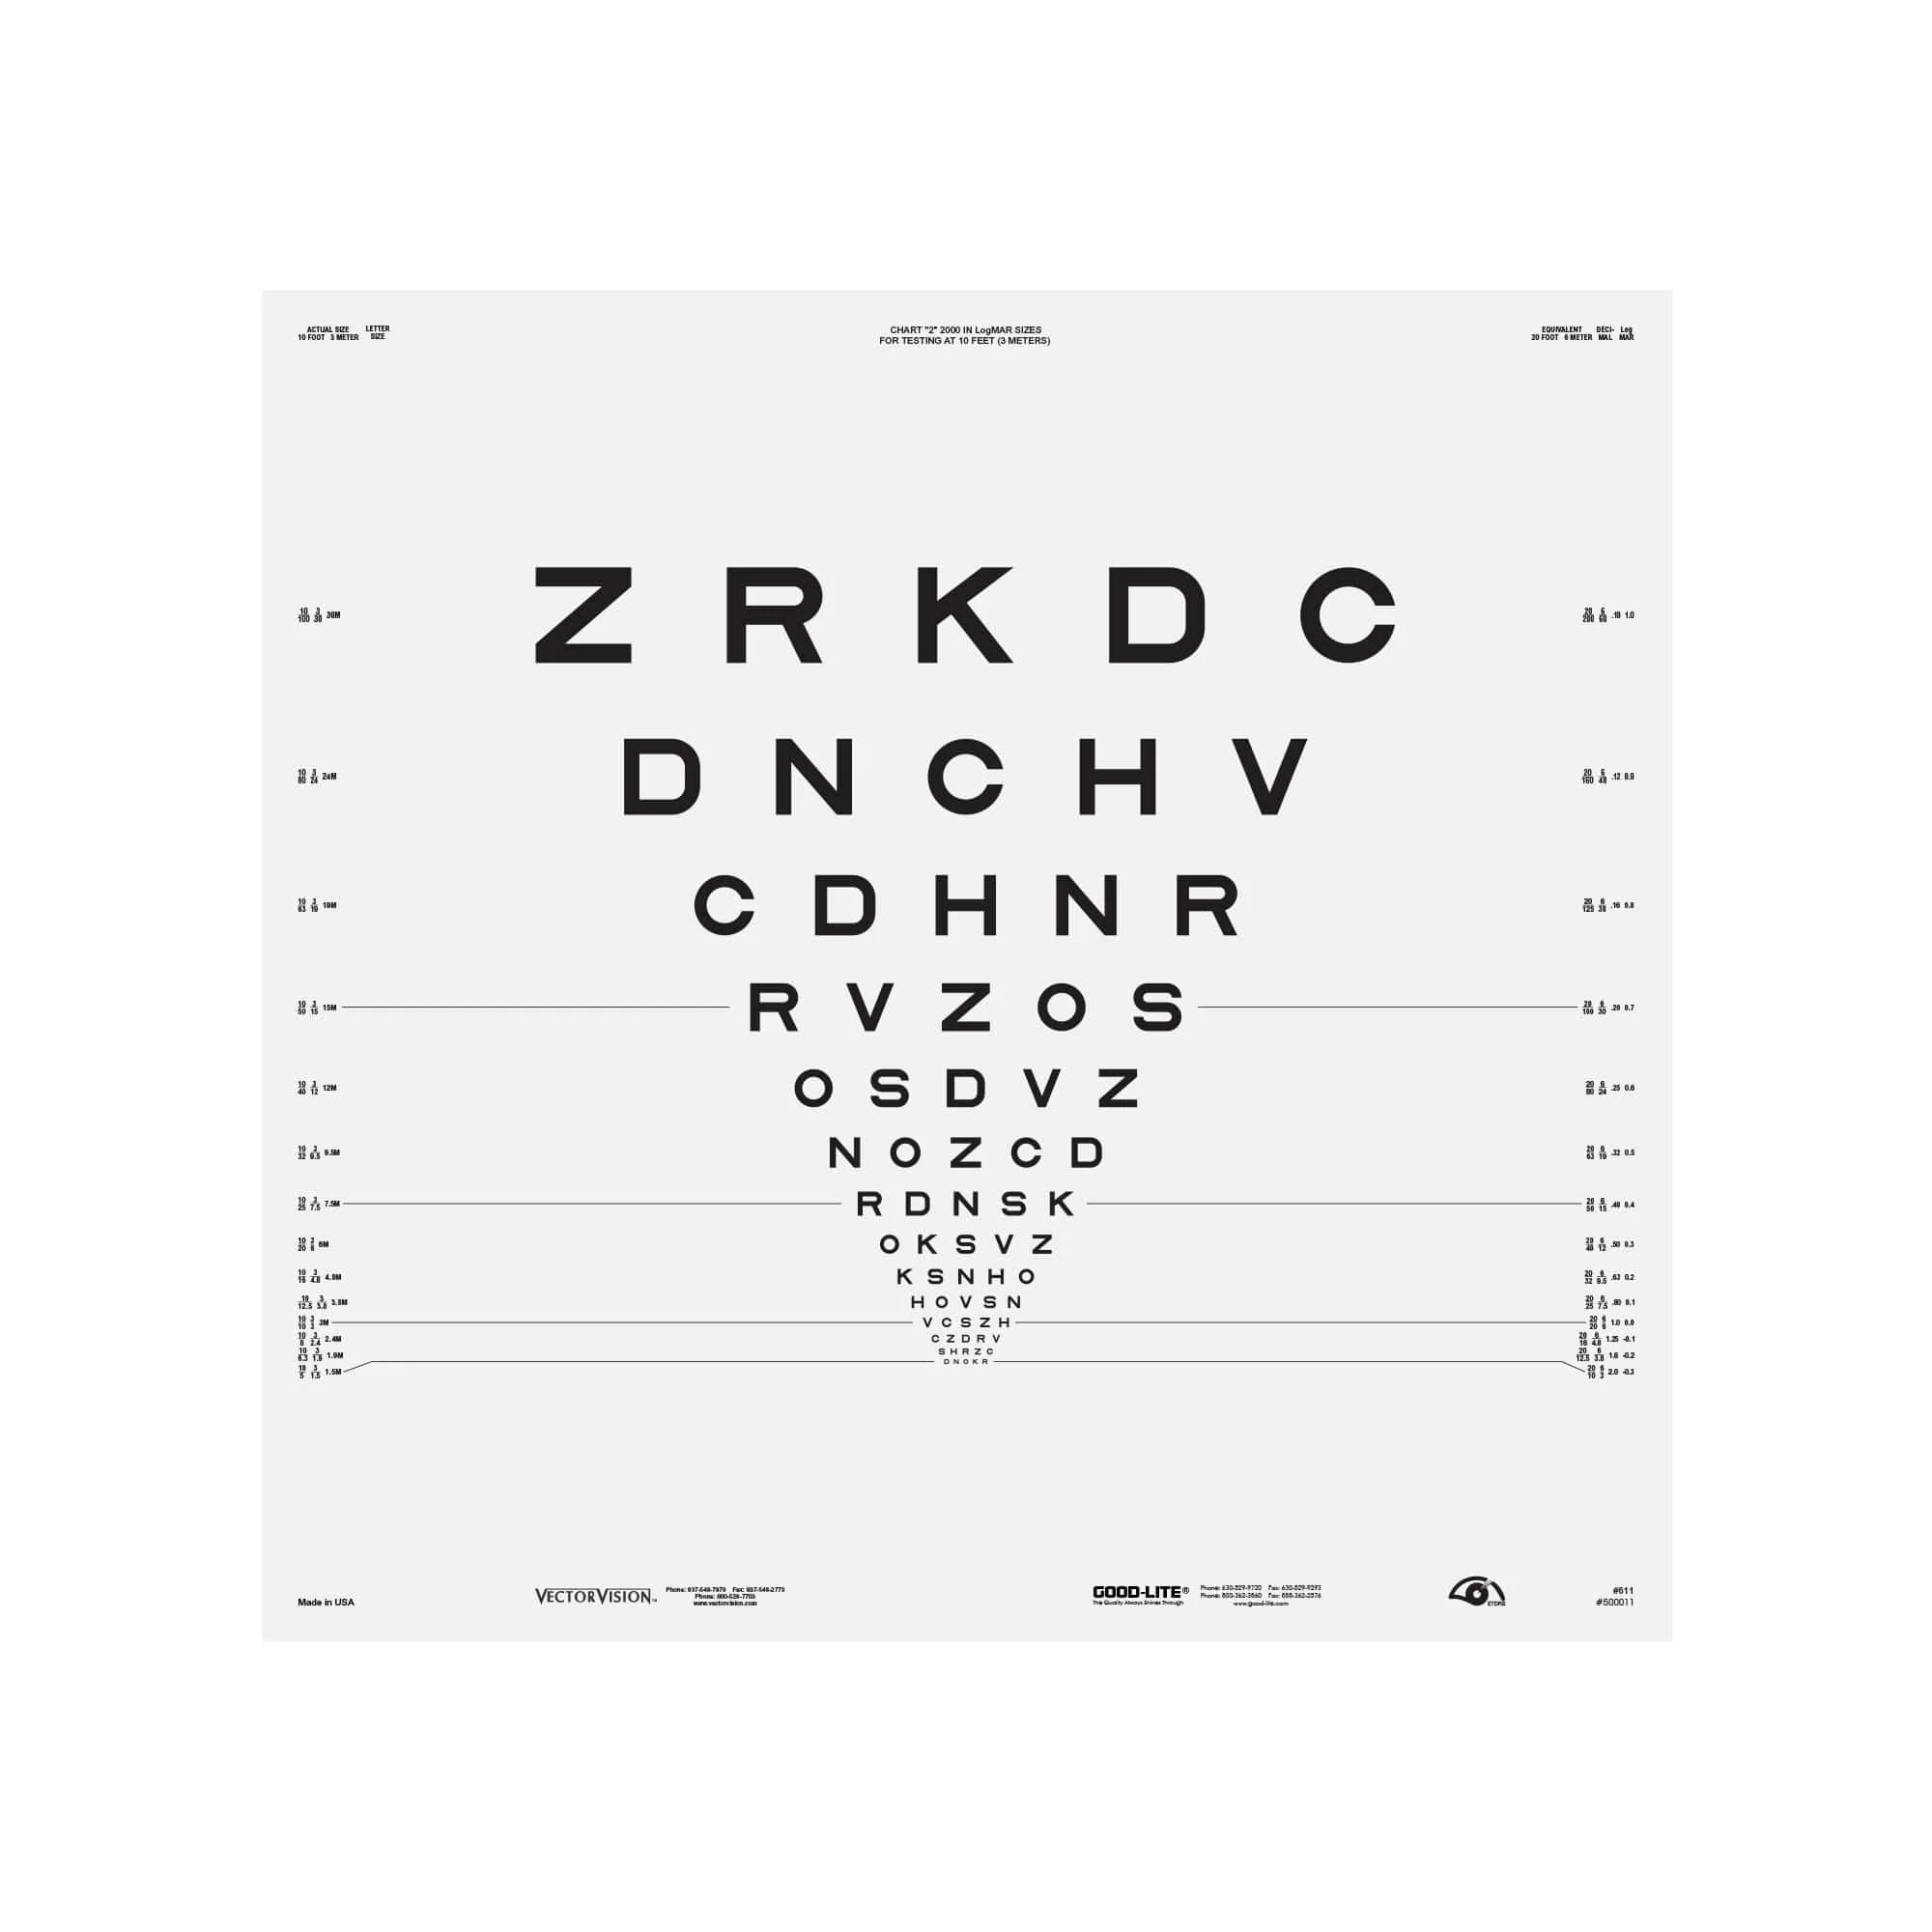
Equipment Description: LogMAR stands for Minimal Angle of Resolution. This is a very accurate method of assessing visual acuity. The chart consists of rows of letters. The letter size is described in LogMAR units where LogMAR 0.00 is equivalent to 6/6 (20/20) and LogMAR 1.00 is equivalent to 6/60 (20/200). The letter size change in units of 0.1 LogMAR from one row to the next. The chart measures the size of the smallest letters you can read in “minutes of arc”. The charts are designed to be used at 4 metres.
Assessment Type: Centre Assessment Only
Protocol
- Each respondent has both eyes tested separately. Start with the right eye.
- The respondent stands behind the red line. Respondents are asked to cover the eye that is not being tested.
- The respondent is asked to read Chart 1 slowly letter by letter starting at the top left-hand corner of the chart and reading across initially, then moving onto the line beneath and repeating this step, reading one letter at a time.
- Repeat on left eye with Chart 2.
Scoring
- The top lines will give a score of 1.0. Each line below will give a score 0.1 less than the line above. Owing to the design of the chart, each of the five letters, in each line, count for a score of 0.1/5 = 0.02. Example:
- If a patient reads the 0.4 line in its entirety they will have a score of 0.4.
- If they read the 0.4 line plus three letters of the 0.3 line, to calculate their score – multiply 0.02 by the correct number of answers on the 0.3 line – here it is 0.02 x 3 (they got 3 answers right on the 0.3 line). – subtract this from the 0.04 (the last line they got all five letters correct)
- 0.4 – (0.02 X 3) = 0.34
- If the respondent had to stand at the 1 metre line for this test, you need to add 0.6 to whatever score they get.
- Positive numbers indicate worse vision, and negative numbers indicate sharper vision.
Collection Waves
| Measure | Wave 1 | Wave 2 | Wave 3 | Wave 4 | Wave 5 | Wave 6 |
|---|---|---|---|---|---|---|
| Visual Acuity | X | X |
Citation
- Bailey, I. L., & Lovie, J. E. (1976). New design principles for visual acuity letter charts. American journal of optometry and physiological optics, 53(11), 740–745. https://doi.org/10.1097/00006324-197611000-00006
Example TILDA Papers
Ní Bhuachalla, B., McGarrigle, C. A., Akuffo, K. O., Peto, T., Beatty, S., & Kenny, R. A. (2015). Phenotypes of orthostatic blood pressure behaviour and association with visual acuity. Clinical Autonomic Research, 25(6), 373-381.
Duggan, E., Donoghue, O., Kenny, R. A., Cronin, H., Loughman, J., & Finucane, C. (2017). Time to refocus assessment of vision in older adults? Contrast sensitivity but not visual acuity is associated with gait in older adults. Journals of Gerontology Series A: Biomedical Sciences and Medical Sciences, 72(12), 1663-1668.